WHO and CDC growth charts, with z-scores and nutritional status
The WHO 2006 and CDC 2000 growth curves, z-scores calculated from the LMS tables, and how to read a child's nutritional status from weight-for-age, length/height-for-age, weight-for-length/height, BMI-for-age and head circumference.
Not just a dot
on paper.
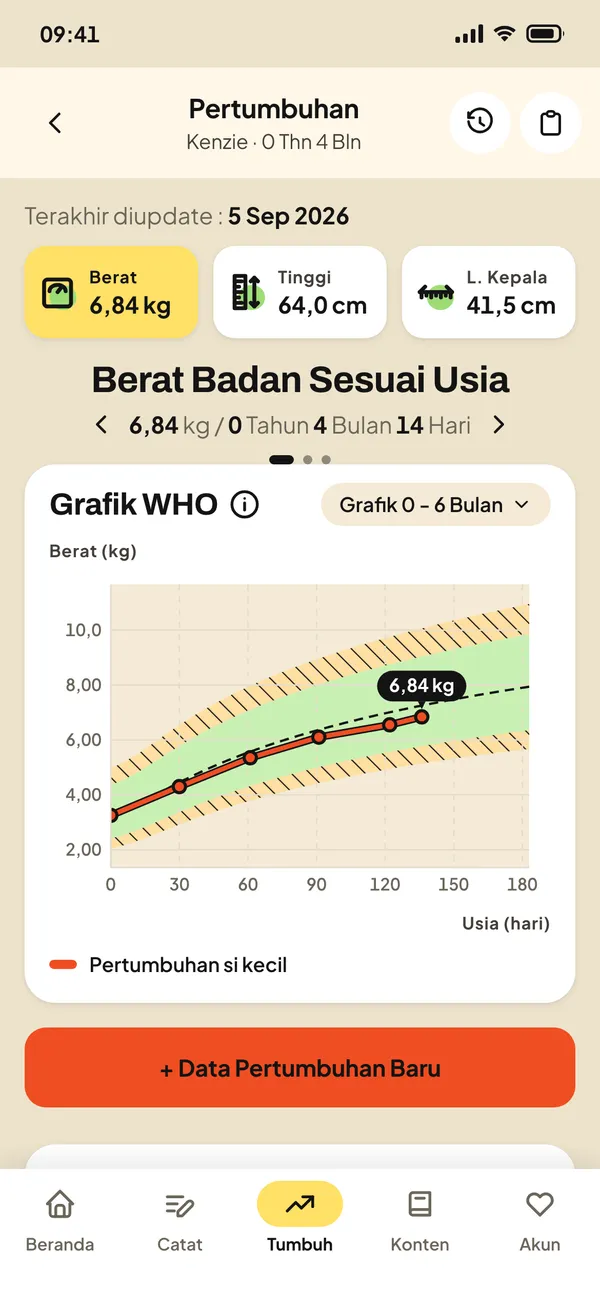
Every weigh-in goes straight onto the official growth curves, with its z-score and a reading of nutritional status. You know what it means without waiting for the next posyandu visit.
- z-score
- Calculated automatically from the LMS tables, with the nutritional status.
- WHO and CDC
- Two standards, switchable at any time on the same screen.
- Genetic height potential
- Estimated from both parents' heights and marked on the curve.
What is a z-score?
A growth chart compares your child's measurements with thousands of healthy children of the same age. The lines on the WHO curves are z-scores: line 0 is the median, +2 and -2 mark the range still considered normal, and -3 or +3 mark values that need special attention.
Reading the growth chart: weight, length and head circumference for age- WHO 2006 curves
- Weight, length and head circumference
- CDC 2000 curves
- The second choice above age 2
- LMS tables
- z-scores are calculated from the official LMS tables carried inside the app, and the results are tested against the SD columns WHO publishes itself.
Nutritional status per indicator
The bands the app uses to read every measurement, following Indonesia's Permenkes 2/2020. The ranges are in z-score units (SD).
Weight-for-age
BB/U in Indonesian charts. Is the weight adequate for the age?
| z-score range | Status | What it means |
|---|---|---|
| below -3 | Severely Underweight Your child's weight is severely low for their age. Schedule a visit to a paediatrician or the nearest health facility promptly for assessment and care. | |
| -3 to below -2 | Underweight Your child's weight is low for their age. Watch their food intake and re-measure every month. Schedule a visit to a paediatrician or the nearest health facility for further assessment. | |
| -2 to below +1 | Normal Your child's weight is appropriate for their age. Keep measuring weight regularly. | |
| +1 and above | Risk of Overweight Your child is at risk of overweight for their age. Weight-for-age cannot tell a heavy child from a tall one, so check the weight-for-height and BMI-for-age charts to be sure. Watch their eating pattern and activity, and keep measuring weight regularly. |
Length/height-for-age
PB/U or TB/U in Indonesian charts. Is the child growing in length as expected?
| z-score range | Status | What it means |
|---|---|---|
| below -3 | Severely Stunted Your child's height is severely low for their age. Schedule a visit to a paediatrician or the nearest health facility promptly for assessment and care. | |
| -3 to below -2 | Stunted Your child's height is low for their age. Watch their nutrition and re-measure every month. Schedule a visit to a paediatrician or the nearest health facility for further assessment. | |
| -2 to below +3 | Normal Your child's height is appropriate for their age. Keep measuring height regularly. | |
| +3 and above | Tall Your child's height is above the range for their age. This is usually not a concern, but schedule a visit to a paediatrician if there are other symptoms. |
Weight-for-length/height
BB/PB or BB/TB in Indonesian charts. The most sensitive short-term nutrition indicator.
| z-score range | Status | What it means |
|---|---|---|
| below -3 | Severely Wasted Your child's weight is severely low for their height (severely wasted). Schedule a visit to a paediatrician or the nearest health facility promptly for assessment and care. | |
| -3 to below -2 | Wasted Your child's weight is low for their height. Watch their food intake and re-measure every month. Schedule a visit to a paediatrician or the nearest health facility for further assessment. | |
| -2 to below +1 | Normal Your child's weight is appropriate for their height. Keep measuring weight and height regularly. | |
| +1 to below +2 | Risk of Overweight Your child is at risk of overweight for their height. Watch their eating pattern and activity, and keep measuring weight regularly. | |
| +2 to below +3 | Overweight Your child is classed as overweight for their height. Schedule a visit to a paediatrician or the nearest health facility for assessment and care. | |
| +3 and above | Obese Your child is classed as obese for their height. Schedule a visit to a paediatrician or the nearest health facility for assessment and care. |
BMI-for-age, 0-5 years
IMT/U in Indonesian charts. Nutritional status by BMI.
| z-score range | Status | What it means |
|---|---|---|
| below -3 | Severely Wasted Your child's weight is severely low based on BMI (severely wasted). Schedule a visit to a paediatrician or the nearest health facility promptly for assessment and care. | |
| -3 to below -2 | Wasted Your child's weight is low based on BMI. Watch their food intake and re-measure every month. Schedule a visit to a paediatrician or the nearest health facility for further assessment. | |
| -2 to below +1 | Normal Your child's weight is appropriate based on BMI. Keep measuring weight and height regularly. | |
| +1 to below +2 | Risk of Overweight Your child is at risk of overweight based on BMI. Watch their eating pattern and activity, and keep measuring weight regularly. | |
| +2 to below +3 | Overweight Your child is classed as overweight based on BMI. Schedule a visit to a paediatrician or the nearest health facility for assessment and care. | |
| +3 and above | Obese Your child is classed as obese based on BMI. Schedule a visit to a paediatrician or the nearest health facility for assessment and care. |
BMI-for-age, 5-18 years
IMT/U in Indonesian charts. Above 5 years, this is the chart used to see a child's nutritional status.
| z-score range | Status | What it means |
|---|---|---|
| below -3 | Severely Wasted Your child is classed as severely thin based on BMI. Schedule a visit to a paediatrician or the nearest health facility promptly for assessment and care. | |
| -3 to below -2 | Wasted Your child is classed as thin based on BMI. Watch their food intake and re-measure weight and height every month. Schedule a visit to a paediatrician or the nearest health facility for further assessment. | |
| -2 to below +1 | Normal Your child's nutritional status is normal based on BMI. Keep measuring weight and height regularly. | |
| +1 to below +2 | Overweight Your child is classed as overweight based on BMI. Schedule a visit to a paediatrician or the nearest health facility for assessment and care. | |
| +2 and above | Obese Your child is classed as obese based on BMI. Schedule a visit to a paediatrician or the nearest health facility for assessment and care. |
Head-circumference-for-age
LK/U in Indonesian charts. Tracks brain growth over the first two years.
| z-score range | Status | What it means |
|---|---|---|
| below -2 | Microcephaly Your child's head circumference is below the normal range for their age. Schedule a visit to a paediatrician or the nearest health facility for further assessment. | |
| -2 to below +2 | Normal Your child's head circumference is appropriate for their age. Keep measuring it every month. | |
| +2 and above | Macrocephaly Your child's head circumference is above the normal range for their age. Schedule a visit to a paediatrician or the nearest health facility for further assessment. |
For further advice, you can schedule a visit to a paediatrician or your nearest health facility. About our sources.
Growth articles

Head circumference: why it is measured until age two
Head size follows brain growth. Here is how to read it without panic.
4 min read

Weight loss in the first week: is it normal?
Almost every newborn loses some birth weight. What you need to know: how much, and when it should come back.
4 min read
Reading the growth chart: weight, length and head circumference for age
The WHO curves are not a report card. What matters is not which line a child sits on, but whether they keep following their own track.
5 min read

Start logging today.
Set up your little one's profile in a few steps, then log their first feed this afternoon.
- Web
- Android
- iOS